PLINK: quick startup guide
February 2, 2015
PLINK is a free, open-source whole genome association analysis toolset, designed to perform a range of basic, large-scale analyses in a computationally efficient manner. The goal here is to give you a quick start with PLINK by showing how to run a GWAS and visualize the results.
Goals:
- Download and install PLINK.
- How to run a GWAS with PLINK.
- Visualize results with a Q-Q plots.
1. Download and Install PLINK:
1.1: To download PLINK go to: http://pngu.mgh.harvard.edu/~purcell/plink/
1.2: In your download directory, extract the downloaded file. 1.3: Set the PATH environment variable:
On Linux and Mac:
cd ~/Downloads/plink/
export PATH=$PATH:$(pwd)
On Windows:
path = C:\PLINK_location;%PATH%
2. How to run a GWAS with PLINK:
2.1: Creat a binary input file to speedup the process:
plink --map chr1.map --ped chr1.ped --chr 1 --make-bed --out chr1_out
2.2: Run the association analysis: GWAS:
plink --bfile chr1_out --allow-no-sex --assoc --adjust --qq-plot --out chr1_out
3. Visualize results with a Q-Q plots:
We are using R and the adjusted p-values for the qq plot to visualize the data:
> data<-read.table(file="chr1_out.assoc.adjusted", header=T)

> head(data)

> plot(-log(data$QQ, 10), -log(data$UNADJ,10), xlab ="expected –logP values", ylab = "observed –logP values")

> abline(a=0, b=1)
This will genrate something like this:
Note:
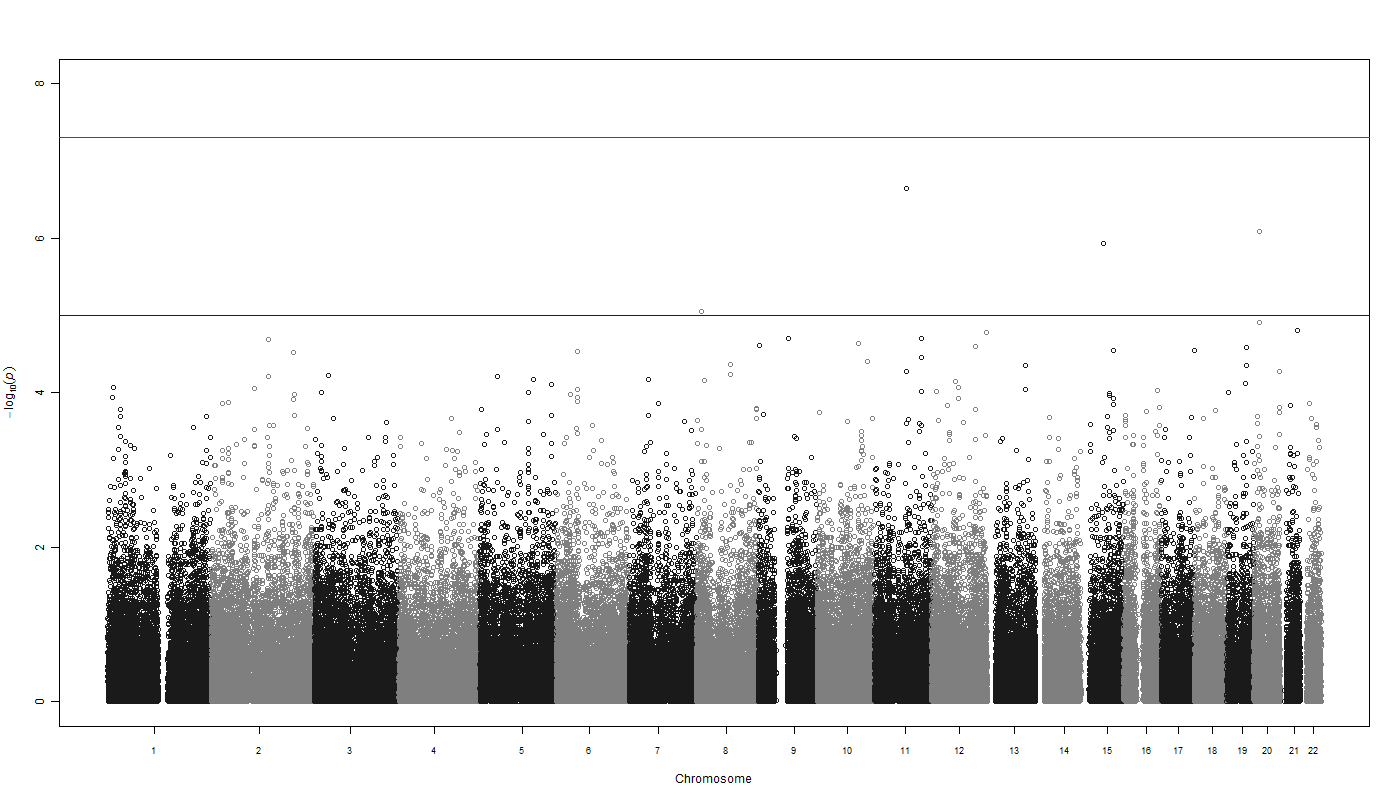
You can use the qqman R package to generate excelent QQ-plots and Manhattan plots. e.g: